The implementation of Precision Change-Over (P.C.O.) Line 4
Define stage 1.
The Line 4 blister machine (BC202) was built in 1990 and is currently the oldest packaging line on our site. Due to customer requirements it is has now become the priority line in our plant. This means that there will be a reduction in batch sizes and an increase of format changeovers. Currently the time it takes to changeover this machine can vary depending on format. The average target changeover time is 9 hours for the majority of formats. However the changeovers can often take over 20 hours which can result in excess waste and quality issues.
What is the goal?
· To standardise and simplify the changeover process
· Remove variation and consistently meet the budgeted 9 hour target
· Minimise waste, rework and inspections on start up.
· Improve morale between the engineering and production teams

The first stage of this project was to create a team with the relevant stakeholders and with the required skill set. This team was made up of the members of the Continuous Improvement team which is dedicated to this line. A project charter was drawn up to include the project statement, objectives and the stakeholders involved.

We processed to create a deployment flowchart describing the roles of different departments and stakeholders involved in the process.

We used Brown Paper Mapping to detail and time the various elements of a changeover. From the picture above, the current changeover state is on the top section of the map. We then brainstormed as a team to identify tasks that could be removed or modified to reduce the overall changeover time. A list was drawn out onto the white board and responsibility given to various team members.
The lower section of the map above is the proposed steps that will need to be taken for future changeovers.
In this example a Batch Interval Time (BIT) on line 4 was mapped out. The changeover time was recorded as 695 minutes. Using PCO we were able to reduce this changeover time to a potential changeover of 314 minutes by removing 61 operations, 10 transports and 12 delays.
The team now have a better understanding of the changeover process and know what the project aims, responsibilities and goals are.
Measure stage 2.
Using both our CMMS (Computerised Maintenance Management System) and BARCO (our OEE measuring tool) we were able to retrospectively map numerous changeovers over a 2 year period. With these measuring tools we were able to confirm the large variation in changeovers on the line. This information was used to identify the differences between the changeovers, the technicians and the production shifts involved. Also with this type information would be extremely useful showing the improvements made once the project has been completed.

During the next stage of the process the group was split in to various sub-teams to collate the information for the different zones of the line. This information was graphed and the results were conclusive. Zone 3 was having the most impact on the changeover time and zone 2 was having the least.

We then carried out a SMED (Single-Minute Exchange of Dies) workshop over two shifts which helped identify key areas in zone 3 that are causing the major time consuming in this section of the changeover.

Analyze stage 3.

We documented the activities carried out by the operators we calculated the time spent doing NVA (non-value added) activities and time spent on VA (value added) activities. We reduced or removed the non-value added activities.

Collectively the entire team reviewed the Activity Maps and Spaghetti Diagrams, then using the 7 wastes they challenged each activity / task to define if it was value adding (VA) or non-value adding (NVA). To simplify the exercise business value adding (BVA) steps were defined as VA.
This prompted in-depth discussion among the team. The exercise increased the teams understanding of value and the importance to challenge what and how they do their work. This exercise became very beneficial to the group. With massive reductions in operator activates as shown above operator 1. saved 51% of time operator 2. saving 49% and operator 3. saving 42% these savings will have a major impact in the objective of reducing the time spent on changeovers.
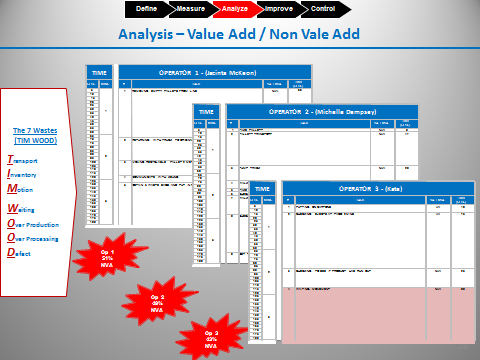
TIM WOODS is a waste of time, resource and energy. All departments within a companies organisation feels his impact.
T – Transport – Moving people, products & information
I – Inventory – Storing parts, pieces, documentation ahead of requirements
M – Motion – Bending, turning, reaching, lifting
I – Inventory – Storing parts, pieces, documentation ahead of requirements
M – Motion – Bending, turning, reaching, lifting
W – Waiting – For parts, information, instructions, equipment
O – Over production – Making more than is required
O – Over processing – Tighter tolerances or higher grade materials than are necessary
D – Defects – Rework, scrap, incorrect documentation
S – Skills – Under utilizing capabilities, delegating tasks with inadequate training
O – Over production – Making more than is required
O – Over processing – Tighter tolerances or higher grade materials than are necessary
D – Defects – Rework, scrap, incorrect documentation
S – Skills – Under utilizing capabilities, delegating tasks with inadequate training
Often employees go about their daily tasks, doing things the way in which they “have always been done” and not questioning whether there is a better, more efficient way to achieve end goals. TIM WOODS is a prompt to help clarify the areas of waste affecting a company’s competitiveness; the eight value-depleting activities which take place during the production of a product or the delivery of a service.
Improve stage 4.
After challenging each step of the changeover process and defining all activities/tasks observed as either VA (value add) or NVA (non-value add), the team redesigned the changeover process for Zone 3 operators. The purpose of this redesign phase was to remove as much NVA as possible from the process and level the loading between the operators performing the tasks.

During the Process Analysis the team diagnosed the following: -
A large amount of waste (motion and waiting) was generated by looking for materials/tools needed to complete the changeover.
The team identified the requirements necessary to improve the work place organisation for line BC-202 through the use of 6S.
A large amount of waste (motion, waiting and over processing) was generated by the need to confirm the status of the machine (clean, clear, clearance check and set up) during the changeover process.
The identified the need to improve the visual control for line bc-202, through the use indicators to highlight the machine status to all operators.

Initially this was started as a post-it note exercise, where one process note defined the activity / task. However this didn’t allow the team to accurately balance the operator loading, as different tasks took different lengths of time to execute.
Therefore a grid with pre-defined time intervals was created so that task duration could be easily visualised allowing the balancing to be completed.
Waste savings
Below is the old product pushers these took up so much space inside the carton as the blister and leaflet were being inserted that damage occurred which caused a lot of inspections on the line and on average 10kgs of waste per 8 hour shift. In our attempt to eliminate or reduce this we redesigned the product pusher in-house.

From an inspection point of view the procedure is on start up the first 2 outers produced would be 100% inspected if a defect was detected we would have to keep inspection until we produced 5 outers with no defects. Since the pushers have been redesigned our 2 outer inspection passes first time every time. The savings on time here is harder to measure as more often then not the production team would try to put more resources on the inspection to get the line running. However the improvement has saved a lot of time and freed up at least 3 production resources for over an hour after every format changeover on line 4.


Operator feedback following the pilot of the re-designed indicated the task list that were provided lacked clarity and created some confusion. As a result pictorial task list were created. These provide activity / task details, line location and sequence.
Also the externalised pre-changeover and post-changeover activities and tasks are clearly identified.

3D Printing

The 3D Systems Project MJP 2500 uses UV light to cure a resin into a rigid plastic, similar to ABS (Acrylonitrile Butadiene Styrene). The resin is pumped from heated reservoirs in the machine to the print head where it is changes from resin to plastic. The MJP 2500 uses non-toxic wax to support the component as it is being created. Like the resin, the wax is pumped from a heated reservoir to the print head where it cools and supports the resin as it cures. When the print is complete the wax support is melted away to leave the finished piece without any further post processing required.
One application of 3D printed parts is reverse engineering. Original equipment can be measured and modelled using 3D Computer Aided Design (CAD) programs such as Solid Works. When complete, the parts can be printed to verify the CAD model or to review the suitability of any changes made prior to being sent for manufacture. The 3D printer is also a huge advantage for prototyping new designs. Initially, designs would be sent for manufacture with a lead time of a few weeks or months depending on the complexity of the components and the workload of the supplier. Any further iterations of the design have to go through the same lead time. With the printer, this process can be done in hours or days, allowing the project to progress through the iterations to a finished design substantially faster.
The machine is also capable of producing complex parts without the restrictions that limit conventional subtractive machining. In some cases, parts that are not possible or feasible can only be created using 3D printing.
3D Scanning
The 3D scanner uses a pair of lasers and cameras to build a 3-dimensional image of an object. The Creaform Handyscan 300 can take up to 480,000 measurements per second with an accuracy of up to 0.03mm. It uses triangulation based on optical reflectors to build an image of the object being scanned.
When a part has been scanned, the software (VXelements) can extract the relevant information (planes, positions, angles, etc.) to recreate a parametric model. The scanner can also be used to verify that a manufactured part is correct relative to its 3D CAD model, providing quality control on supplier quality inspection, part to CAD inspection, etc.
The lightweight handheld device can be brought to the equipment where needed. The scanner can be used to reverse engineer components, particularly when they are too complex to be measured using conventional measuring equipment (calipers, protractors, rulers, etc.)
Scanning and 3D printing examples

Above is a worn CAM in machine BC-202 this part is no longer supplied by the original equipment manufacture. They offered to make this but at a very high cost.
The wear to this part caused a lot of unnecessary movement in the machine. This part was completely rebuilt in-house as a result costs were kept to a minimum and we were in full control of the time frames of each step of the process. The removal of all this movement has made the machine much more reliable and the changeover setting require much less adjustments for different formats.
The wear to this part caused a lot of unnecessary movement in the machine. This part was completely rebuilt in-house as a result costs were kept to a minimum and we were in full control of the time frames of each step of the process. The removal of all this movement has made the machine much more reliable and the changeover setting require much less adjustments for different formats.

Move overhauling by the engineering team
 | ||||
| Sealing plate rebuilt |
 |
| Sealing plates stripped |
 |
| The front of the blister machine rebuilt |
 |
| The front of the blister machine stripped |
 |
| Cartoner machine stripped |
 | |
| Cartoner machine rebuilt |
Control stage 5.
Production Feedback
- · The diagrams and task lists crated during this project clearly defined the responsibilities of all operators on the line.
- · We all are aware of our direct roles and we now work like a professional team.
- · The structured process of “enable quicker” demonstrated during this project has been provided in a very safe and controlled manner.
- · The diagrams and task lists contain minor omissions that need to be addressed, as they created some minor confusion while executing the first pilot of the re-designed process, but with more time using this new approach we can only see the changeover process improve.
- The waste reduction and improved inspection checks on start up has had a major impact on the success of this project but it has also enabled the team to support engineering with minor tasks on the line which saves the technician time and the production team are gaining more experience on the line which is a major positive for everyone involved.
Lessons Learnt
- · Ensure all key roles responsible for the process are represented in the team.
- · Communicate very clearly to individuals which may not be involved in the SMED workshop(s) but are expected to execute the output.
- · The power of brown paper mapping analysis and spaghetti diagrams - this really challenged the teams understanding of waste (NVA) and provided a “wow” factor visual impact. These tools also helped break the ice in getting all members of the team to interact and share their opinions.
- · Work closely with packaging/production and planning to schedule the line appropriately during the SMED workshops - ensure sufficient changeovers are available to pilot the process.
Barriers to Reaching Project Realisation
- · The following factors contributed to a slower than anticipated realisation of project goals: -
- · Changes to operational staff
- · A 25% change to the line crews meant the redesigned processes couldn’t be used until all the new crew members were trained and qualified in the relevant operational work instructions.
- · Changes to area line leads
- · Supervisors and Leaders needed to become more familiar with the process.
- · Conflicting priorities or change of company objectives mid project.
- · The implementation of different initiatives changed the focus of the line crews.
Improve Conclusions
- · Solutions were generated, selected, assessed as the workshop progressed.
- · Solutions requiring longer evaluation/risk assessment were escalated to be reviewed and are planned to be implement during the next stages of line performance improvement.
- · The evaluation of the changeover times with the original baseline data and the changeover time frames since PCO confirms the project’s success.
Our original project proposal;
The success of this project will result in;
· A saving of €30,000
· Changeover time reduced by 20%
· An increase in OEE of 3-5%
· A reduction in waste of 10%
Results of all these changes can be seen in the most recent changeovers below
The last 8 batch changeovers have proved a reduction in batch changeover time and variation. The batch changeover time for those batches took on average 4 hours less and inside the target time this has been a decrease in time of over 30%

Our mean (the green line) at the start of the project showed our changeover average time was 13hrs we agreed to reduce this by 20% the mean of the last 8 changeovers is now down to 9hrs with a reduction of 30%

Control plan was agreed with the Packaging Manager and Team Leaders to ensure
workshop improvements were not lost.

The continuous improvement structure within the organisation will continue on an going bases.
The engineering and production teams will continue to meet up for a 1 hour get together once a week whether needed or not, as well as times of need to continue the progress made in the short 16 week period we spend implementing The PCO Process of Line 4.
Thank you to all the team for their energy, enthusiasm and tenacity to achieve an impressive step change in the process.
Thank you to Paul Sherlock project supervisor (Sligo IT) to Mark Ryan the project supervisor within my organisation and Wes Horan my engineering manager and project sponsor you have provided fantastic guidance and support throughout the workshops and project life-cycle.
This comment has been removed by the author.
ReplyDelete